Multifocal
ERG/VEP M-sequence
(Maximal sequence)
Ai-Hou
Wang, M.D., Ph.D.
During
my year-long Fellowship of Pediatric Ophthalmology and Strabismus at The
Smith-Kettlewell Eye Research Institute (SKERI) in San Francisco from the
summer of 1990 to the summer of 1991, I had the opportunity to work with two
electrophysiological designs: Dr. Erich Sutter's
multifocal electroretinography (ERG) and Dr. Anthony Norcia
and Dr. Christopher
Tyler's sweep visual evoked potentials (Sweep VEP). Currently, the
International Society for Clinical Electrophysiology of Vision (ISCEV) has
standards for multifocal ERG (https://iscev.wildapricot.org/standards),
but standards for sweep VEP have not yet been included. Besides clinical use,
these two tools are also invaluable for basic scientific research in vision.

Using
images to elicit electrical responses in the retina and visual cortex is called
pattern ERG and pattern VEP. The most commonly used
image is a checkerboard reversal (left image).
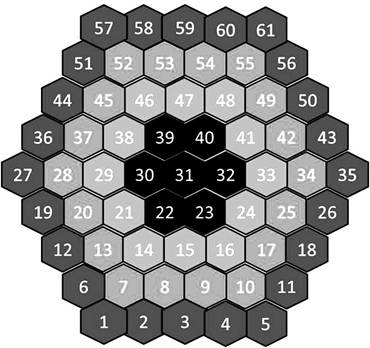
Multifocal
ERG and multifocal VEP use the pattern shown in the right figure as the visual
stimulator.


The
method of recording multifocal ERG is similar to that
of pattern ERG (left figure), using the screen image as the visual stimulator
while keeping a constant average screen brightness. Its
records the electric response to each small hexagon (right figure). Locally, it
however appears similar to flash ERG.
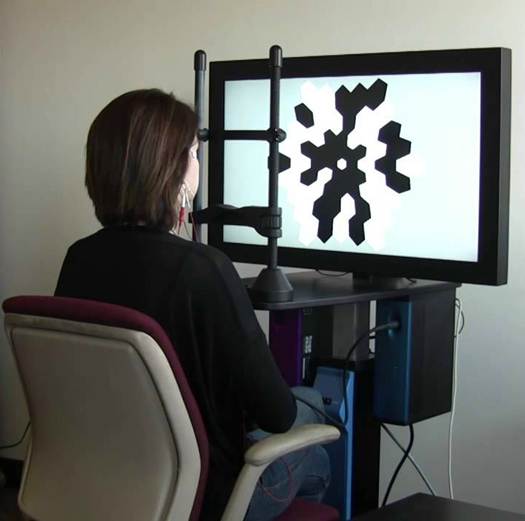
The
electrodes used to record multifocal ERG are no different from those used in
ordinary ERG (see figure). So many hexagons are flashing simultaneously,
stimulating every local retinal area. How is it possible to analyze and record
so many individual retinal responses? The calculation is a sophisticated 0-1
mathematical approach called the maximum sequence (M-sequence).

This article will explain the calculation of
M-sequence and introduce our alternative method and findings in recording
binocular VEP with M-sequence.
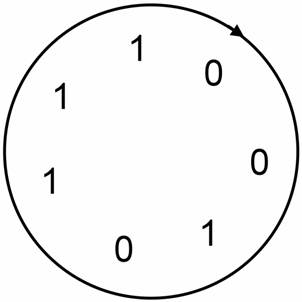
The M-sequence,
also known as pseudorandom M-sequence, is a sequence of 0��s and 1��s (see
figure). While it appears to be a random arrangement of 0��s and 1��s, the
generation of this sequence follows a formula and is not truly random; hence the name pseudorandom sequence. In
psychophysical or physiological experiments, the appearance of 0��s and 1��s is
essentially random and unpredictable.
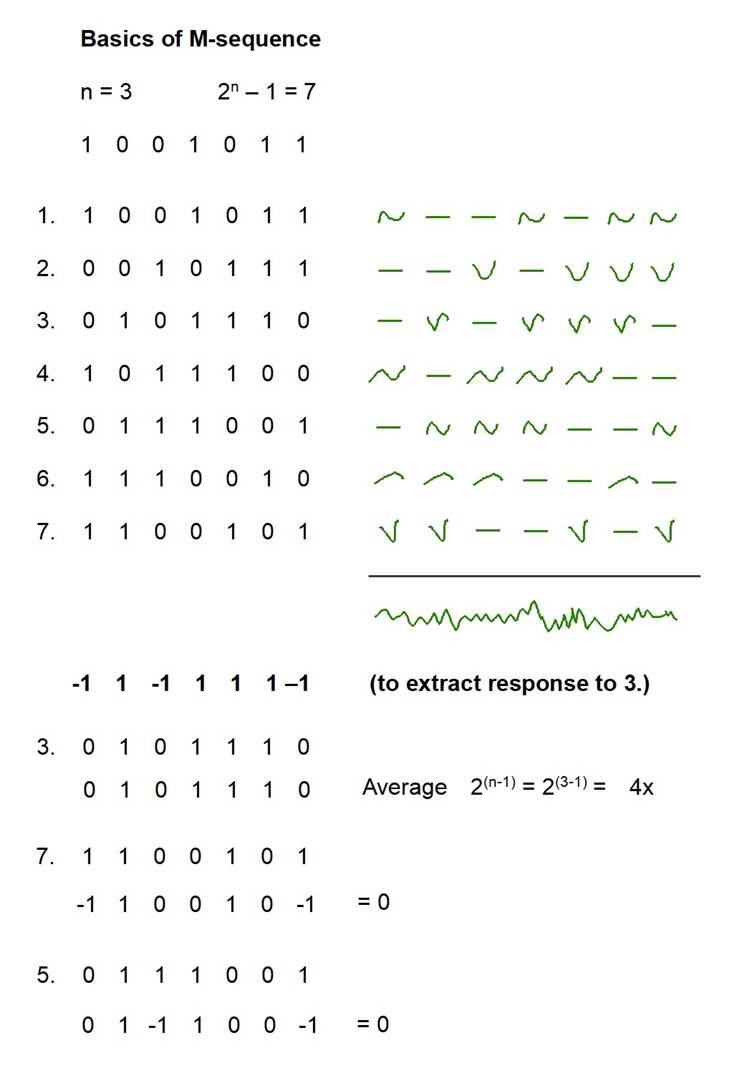
The
length of M-sequence (the total number of 0��s and 1��s) is 2n-1 0��s
and 1��s for a given integer n. The sequence contains 2n-1 1��s and 2
n-1 - 1 0��s, with one more 1 than 0.
The
M-sequence of n = 3 has 23 - 1 = 7 0��s and 1��s.
[
1 0 0 1 0 1 1 ]
It is a loop; you can start from any position of the
loop. There are 7 M-sequences.
The M-sequence of n = 7 has 27 - 1 = 127 0��s and 1��s.
[ 0 0 0 0 0 0 1 1 1 1 1 1 1 1 0 1 0 1 0 1 0 0 1 1 0 0 1 1
1 0 1 1 1 0 1 0 0 1 0 1 1
0 0 0 1 1 0 1 1 1 1 0 1 1 0 1 0 1 1 0 1 1 0 0 1 0 0 1 0 0
0 1 1 1 0 0 0 1 0 0 0 1 1 1 0 0 0 1 0 1
1 1 1 1 0 0 1 0 1 0 1 1 1 0 0 1 0 0 0 1 0 0 1 1 1 1 0 0 0
1 0 1 0 0 0 0 1
1 0 [0 0 0 0 1]
Let's first look at the secret of how the M-sequence can
analyze and record so many individual retinal responses �V
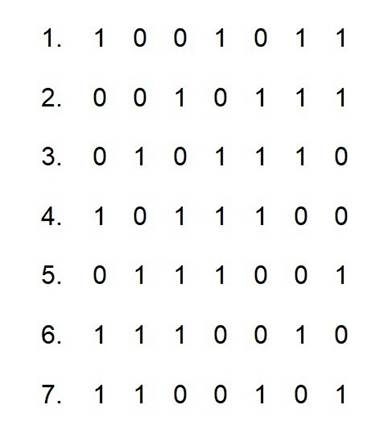
As mentioned before, there are 7 M-sequences with n = 3.
A stimulus is input according to each sequence �V if it��s 1 in the sequence, a
stimulus is given, and a response is obtained; if it��s 0 in the sequence, no
stimulus is given, and no response is obtained (see figure). 7 stimuli are
input simultaneously according to these 7 M-sequences, and the 7 responses are
summed together to give the output.
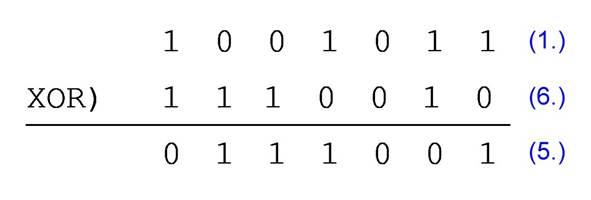
We multiply the summed responses by [-1 1 -1 1 1 1 -1]
according to the third M-sequence [0 1 0 1 1 1 0]. We subtract when it��s 0 in
the sequence and add when it��s 1 in the sequence. The calculation result for
the 3rd input is a sum of 2(3-1) = 4 times. The calculation result
for the 5th input is to add twice and to subtract twice, that cancel out each
other to get 0 result; the calculation result for the 7th input is also to add
twice and to subtract twice, canceling out to get 0 result. Except for the response
from the third sequence stimulus, which is summed four times, the responses
from the other six sequences are cancelled out by themself and do not appear in
the calculation result. Therefore, the response from the third sequence
stimulus can be extracted from the summed responses. Similarly, by adding and
subtracting the summed responses based on the 0��s and 1��s of the other six
sequences, we would be able to obtain individual response from each sequence
stimulus.
Thus, the M-sequence is a multiple-input, single-output system.
By utilizing the characteristics of M-sequence, the individual response from
each input can be separated from the single output.
About
this magical mathematics of 0 and 1, please refer to ��Shift Register Sequences��
by Solomon W. Golomb
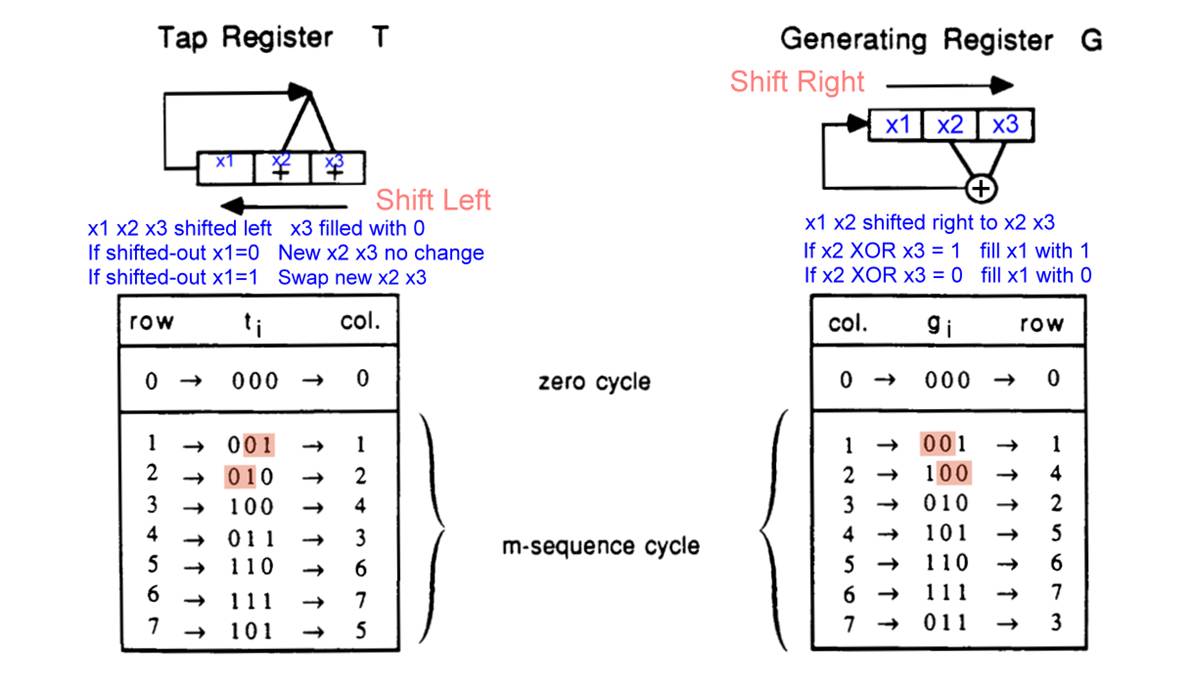
How to generate M-sequence?
First, let's review binary numbers: 1 (001) 2 (010) 3 (011) 4 (100) 5 (101) 6 (110) 7 (111)
Here, we use the most basic and shortest M-sequence with
n = 3 as an example.
There are two ways of Shift Registers: shift left and
shift right.
The first method (left figure) �V The three positions of
the generating register are designated as x1, x2, and x3.
x2 and x3 are shifted left to x1 and x2, and x3 position
is filled with 0.
If the shifted-out x1 is 0, the 0 or 1 at two right
positions remain unchanged
If the shifted-out x1 is 1, the 0 or 1 at two right
positions are inverted (0 becomes 1, 1 becomes 0) �V in other words, the
generating register contents are XORed with the tap register 3 (011).
Starting from 1 (001), repeat this register shifting
process. The generating register will sequentially become 2 (010), 4 (100), 3
(011), 6 (110), 7 (111), and 5 (101), then return to its starting number of 1
(001).
The sequentially shifted-out 0 or 1 from left side of the
generating register construct [0 0 1 0 1 1 1], which is the M-sequence of
length 23-1=7.
The second method (right figure) �V the three positions of
the generating register are also designated as x1, x2, and x3.
x1 and x2 are shifted right to x2 and x3.
If before the shift, x2 XOR x3 = 1, the x1 position is
filled with 1.
If x2 XOR x3 = 0, the x1 position is filled with 0.
Starting from 1 (001), the register is repeatedly shifted,
the content of the generating register will sequentially go through 4 (100), 2
(010), 5 (101), 6 (110), 7 (111), and 3 (011), before it returns to the
starting number of 1 (001).
The sequence [1 0 0 1 0 1 1] derived from shifted-out 0
or 1 from right side of the generating register is the M-sequence of length 23-1=7.
This
is the BASIC program that generates the M-sequence of n = 7 and tap = 65,
according to the first method:
DEFINT
A-Z
n
= 7
tap
= 65 ��---------------------------------------------------
tap-register = 65 (1000001)
nn = 2 ^ n �V 1
DIM
M(nn) ��------------------------------------------------ Length
of M-sequence 2n-1
M(1) = 1 ��---------------------------------------------------
Starting value = 1
CLS
FOR
i = 1 TO nn
IF M(i) >= 2 ^ (n -
1) THEN ��--------------------------- If 1 is shifted out
PRINT " 1"; ��-------------------------------------------
This bit of the M-sequence is 1
M(i + 1) = ((M(i) - 2 ^ (n - 1)) * 2) XOR tap ��------- Generating
register XOR tap-register (65) to get new generating register
ELSE '-------------------------------------------------------
Otherwise, if 0 is shifted out
PRINT "0"; '-------------------------------------------- This bit in the
M-sequence is 0
M(i + 1) = M(i) * 2 '---------------------------------------
The generating register remains unchanged
END IF
NEXT
END
M-sequence
of length 27 - 1 = 127 is generated:

The selection of the tap register is crucial. In the
first method described above, when x1 shifted out is 1, the generating register
is XORed with the tap register to get the new generating register.
A register containing n 0��s or 1��s has 2n
possible arrangement of 0��s and 1��s, which, in binary terms, represent
consecutive integers from 0 to 2n-1.
A poorly selected tap will make the generating register
go back to its starting value too early, not going through all 2n-1
integers. It loops within a smaller cycle without containing all 2n-1
integers. A good tap, on the other hand, the generating register will pass
through all 2n-1 integers (excluding 0) before returning to the
beginning, resulting in a sequence called the ��maximal sequence�� (M-sequence) and possessing some of the special
properties of the M-sequence.
A good tap must have an even number of 1s, but a tap with
an even number of 1s is not necessarily a good tap.
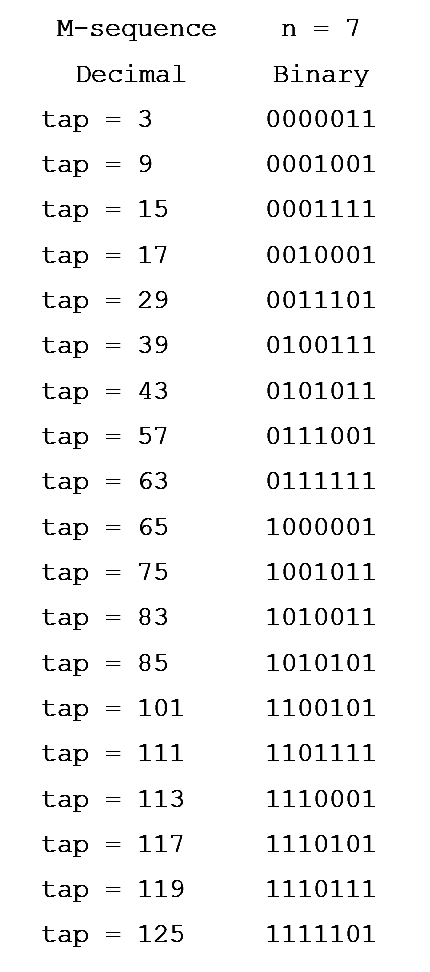
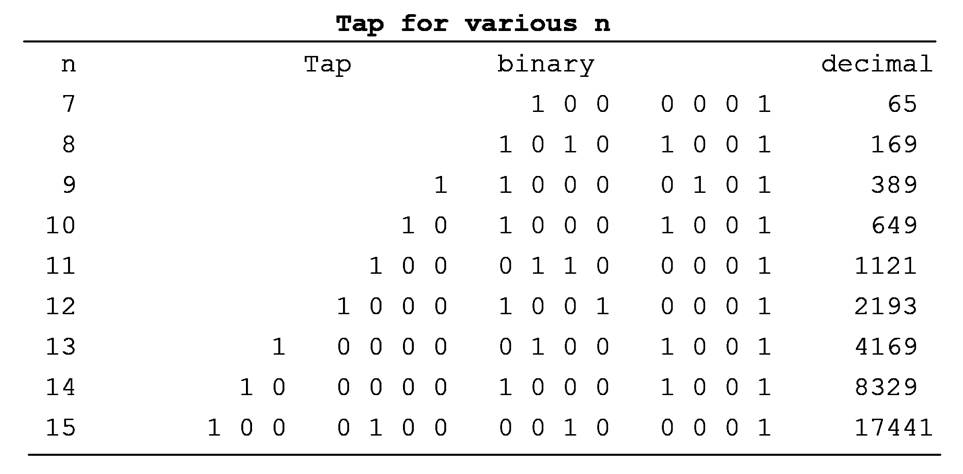
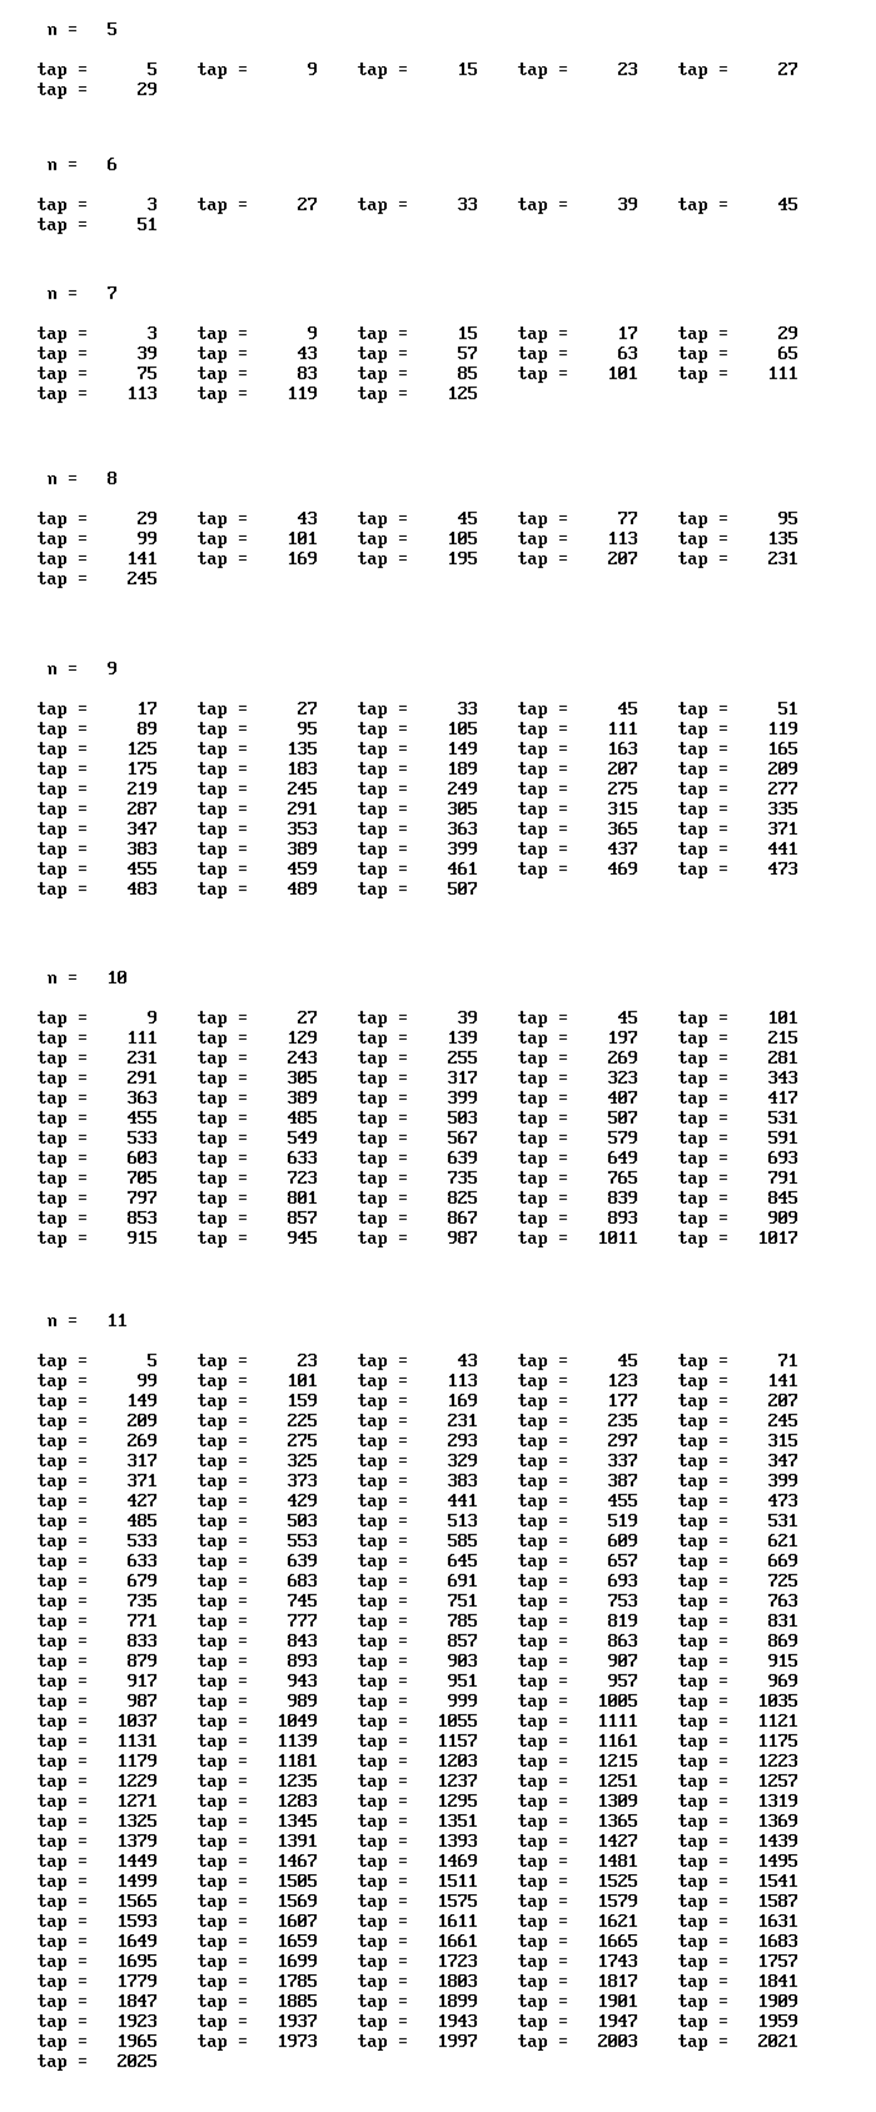
The following
are good taps that would generate M-sequence from n=5 to n=11:
Special Properties of M-Sequence
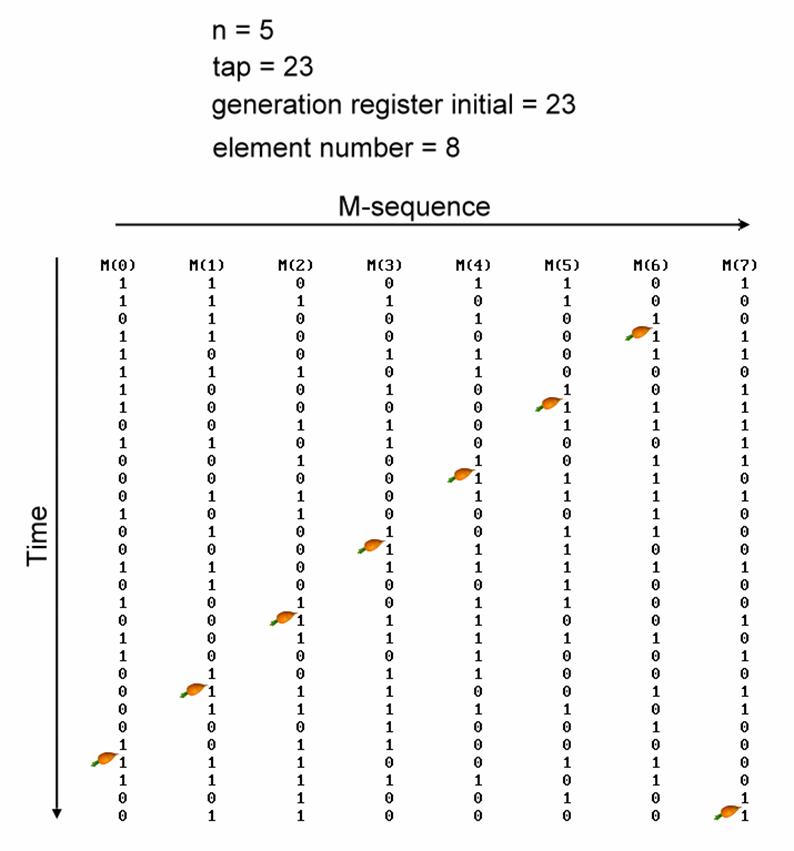
¨
The most
important property of M-sequence is the method of extracting the responses to
each input. The previous section described the method of extracting responses
with M-sequence of n = 3. Here, we have 8 inputs, stimulated by the same
M-sequence with n = 5, but from different starting points (red arrows) (see
figure). Extracting the response from the summed responses using the -1, 1
sequence corresponding to the 0, 1 of input 1 (see figure) will yield the
response to input 1. This response is an average of 2(n-1) = 24
= 16 responses. Average of m responsses will increase the signal-to-noise ratio
(S/N ratio) by ��m times; here, the
S/N ratio of each responses is increased by 2(n-1)/2 = 24/2
= 22 = 4 times.
[ 1 1
0 1 1
1 1 1
0 1 0
0 0 1
0 0 1
0 1 0
1 ........]
[ 1 1 -1 1
1 1 1
1 -1
¨
The length of
M-sequence as generated by an
n-bit generating register is 2n-1. It contains 2(n-1) 1��s
and 2(n-1)-1 0��s. In the hexagonal array of a multifocal ERG, if 1
is white and 0 is black, the number of black and white hexagons will always be
approximately equal, and the entire screen will maintain a fixed average
luminance (see figure).

¨
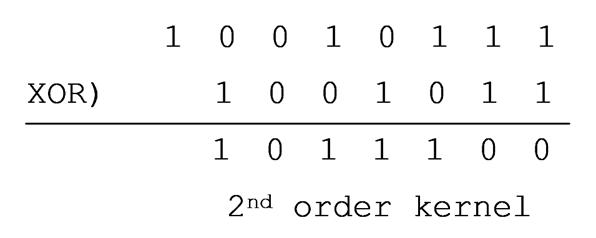
Bit-by-bit XOR
logic operation between any two M-sequences with different starting point among
the 2n-1 M-sequences yields another M-sequence in this group. The
resulting M-sequence is called the 2nd-order kernel, which can be interpreted
as the interaction of the original two M-sequences. However, in jumping into
this interpretation it's crucial to look over the experimental design and the
application of M-sequences to avoid arriving at unforeseen conclusions.
For example, XORing the 1st and 6th M-sequences among a
group of 7 (n=3) M-sequences (left figure) yields the 5th M-sequence (right
figure). Should the response extracted from this 5th M-sequence be interpreted
as a response evoked by the 5th M-sequence stimulus itself, or as an
interaction between the 1st and 6th responses? The solution is to use longer
M-sequences with larger n values to avoid the duplication and confusion.
¨
To achieve good S/N ratio,
multifocal ERG with 241 hexagons needs a long M-sequence. For example,
M-sequence with n=16 contains 216-1 = 65535 0��s and 1��s. Even if
using a computer with 60 displays per second, it would take 65535 / 60 = 1092
seconds = 18 minutes to complete the recording. Nobody would tolerate 18
minutes experiment or examination staring at the computer screen. The recording
is thus broken down into 36 half-minute segments, and the recorded data are
then connected for analysis.
¨
Another example of M-sequence
interaction is the recording of VEP applying M-sequence. Clinical VEP testing
typically uses checkerboard reversal as visual stimulator. Two checkerboards,
checkerboard 1 and checkerboard 2, are regularly reversed at a constant
frequency (left figure). The right figure shows a checkerboard pattern reversed
following an M-sequence �V when the M-sequence is 0, checkerboard 1 is
displayed, and when the M-sequence is 1, checkerboard 2 is displayed.


Checkerboard reversal
regularly Checkerboard reversal
following M-sequence.
¨
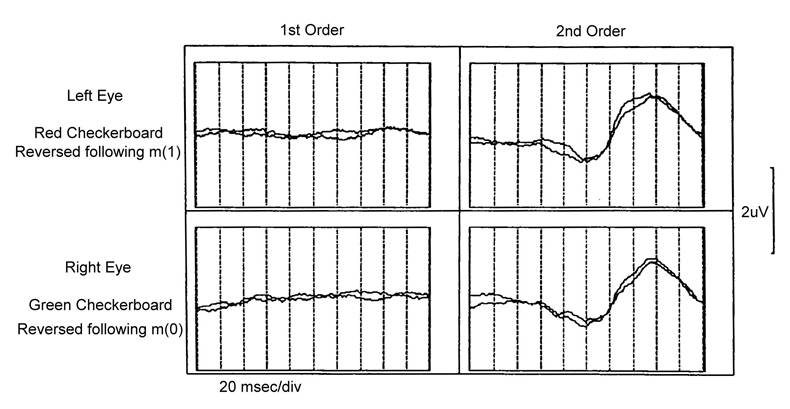
Using this M-sequence to extract VEP
from electroencephalogram (EEG) yields a first-order kernel response. There is
no response extracted (left column of right figure). Because the VEP is coming
from the ��reversal�� of the checkerboard, not from the checkerboard itself. To
extract the VEP from the ��reversal��, we must use the M-sequence generated by
XORing two consecutive M-sequences (left figure). This is called a second-order
kernel response. We thus get an NPN waveform similar to
that evoked by traditional checkerboard reversal (right column of right
figure).
If the experimental is designed as swaping the
checkerboards when M-sequence is 1, and keeping the checkerboard unchanged when
it's 0, then VEP will be extracted using the first-order kernel M-sequence.
¨
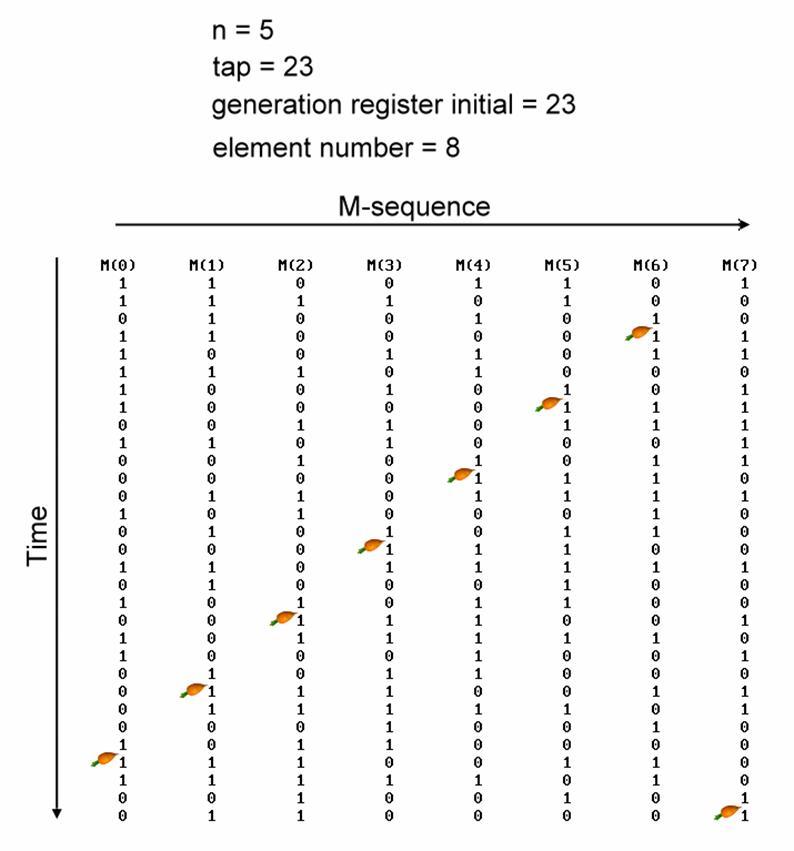
M-sequence can
be real-time generated during experiments, without needing to prepare it
beforehand. For example, with 8 elements, such as a multifocal ERG with 8
spots, at time 1 the 0��s and 1��s of the M-sequence are sequentially assigned to
the 8 elements (see figure, from left to right). At time 2, the sebsequent 0��s
and 1��s along the same M-sequence are assigned to the 8 elements at time 2 (see
figure, from top to bottom), and so on for time 3, time 4, and so on. Once the
2n-1 0��s and 1��s of the M-sequence is used up, the cycle starts
again from the beginning.
With this unique assignment of M-sequence
from left to right and from top to bottom, when a single element is viewed
vertically from top to bottom, it keeps to be the original M-sequence, yet with
different starting point! The start points of M-sequence of these 8 spots is
evenly distributed at positions 1/8 the length of this M-sequence (the red
arrow in the diagram)!
¨
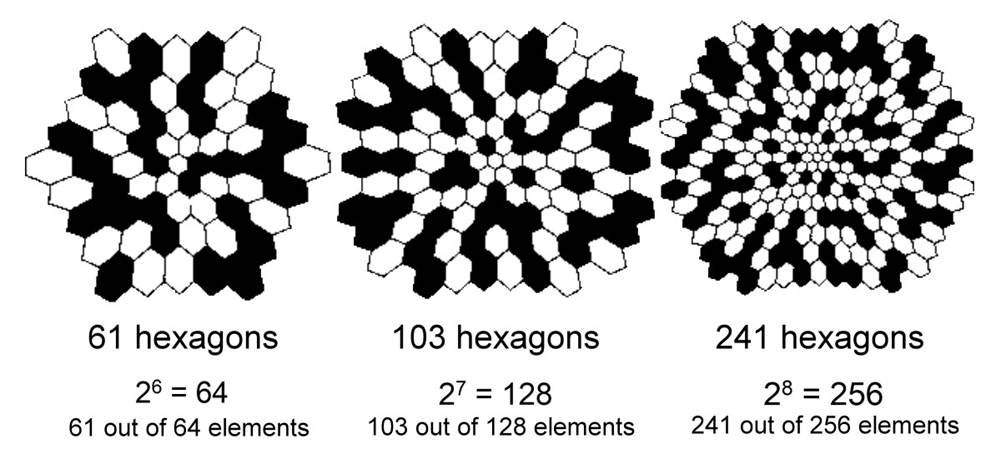
The number of spots
must be a power of 2, such as 1 (20), 2 (21), 4 (22),
..., 256 (28), ..., 2048 (211), 4096 (212) ...
to achieve the aforementioned property of laterally assignment of 0 and 1. The
61 hexagons, 103 hexagons, and 241 hexagons in the multifocal ERG program must
be using 64 (26), 128 (27), and 256 (28) spots
respectively to assign the 0��s and 1��s of the M-sequence (see figure).
¨
This is a
dynamic diagram illustrating the sequential allocation of 0��s and 1��s along an
M-sequence (n=9, length 29-1, tap=33, initial value=67) to 16
elements (see figure, from left to right). After allocating the first 16
elements, the subsequent 0��s and 1��s along the original M-sequence is continued
to be allocated to the second 16 elements (see figure, from top to bottom), and
to the third, the fourth 16 elements, and so on. Once 2n-1 0��s and
1��s of the M-sequence is used up, the loop starts again. With this allocation
of M-sequence from left to right and from top to bottom, when each element is
viewed vertically from top to bottom, it remains to be the original M-sequence,
with different starting point! The starting points of M-sequence of these 16
element are evenly distributed at positions 1/16 of the length of the
M-sequence.

¨
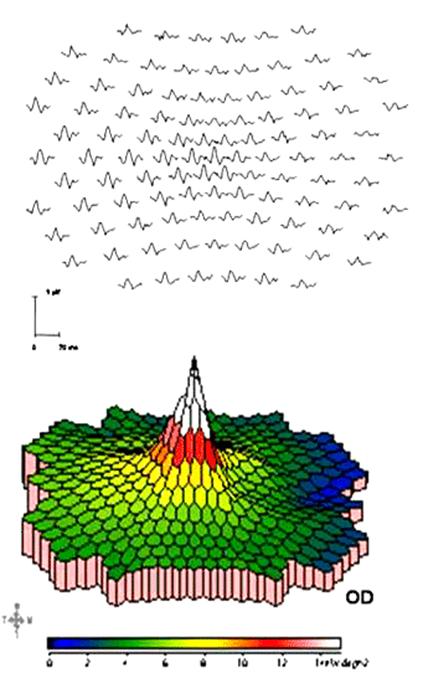
The 61 hexagons
in a multifocal ERG can all be the same size, as shown in the left figure.
However, considering the properties that the central visual field has higher
sensitivity, larger electrical response, and smaller receptive field, the 61
hexagons are designed to be smaller in the center and larger at the periphery
(right figure).

¨
In addition
to generating sequences ��instantly��, the longest sequence can also be analyzed
��instantly�� without needing post-production. The starting points of M-sequences
for these eight elements are known. As the experiment progresses, the
corresponding -1 and 1 sequences for each element are applied to extract the
data. The responses of this element are gradually
averaged and emerge, while the responses of other elements are gradually
cancelled out and diminish. And the responses of each element are gradually
separated and appear. At the end of the experiment, the analysis is already
completed to yield the separate, individual response of each element. This, of
course, requires rapid and large amount computation. Here the Fast
Walsh-Hadamard Transform (FWT)
is the solution.
As mentioned above, the M-sequence can generate
visual stimuli instantly without prior calculation or preparation, the
extraction of responses from each element with M-sequence can also be completed
instantly without post-production. Although this mass computation could be done
by storing EEG and ERG for later processing, if the responses of at least one
element can be presented instantly during the experiment or examination, we
would be able to monitor the whole recording course and detect any error immediately.
For fast, real-time analysis of M-sequences, please refer to Hadamard-Walsh Transform�AFast
Walsh-Hadamard Transform (FWT). It
is a generalized Fourier Transform�AFast Fourier
Transform (FFT). Although
the mathematical operations of these transformations are complicated, the
algorithms are publicly available and not entirely inaccessible.
(The Hadamard transform is also known as the
Walsh�VHadamard transform, Hadamard�VRademacher�VWalsh transform, Walsh transform,
or Walsh�VFourier transform.)


Jacques Solomon Hadamard(1865-1963)�AHans Adolph Rademacher(1892�V1969)�AJoseph Leonard Walsh(1895�V1973)
This is Erich Sutter's system, EDI's VERIS.

Erich Sutter did not apply a patent in Europe.
There��s German company copied the system, the RETI-scan visual
electrophysiology system (Roland GmbH, Germany).

The following visual electrophysiology systems
were showcased:
EDI VERIS (USA),
RETI-scan (Germany),
Diagnosis (USA), and
Metro Vision (France).
At a conference in mainland China, I had seen Chinese
companies also presented their own version of this system.
GT-2000NV (Chongqing Guote
Medical Equipment Co., Ltd.),
BIO-2000 (Nanchang Wufang
Medical Device Co., Ltd.),
IVE-205A (Chongqing Airxi
Medical Equipment Co., Ltd.), and
APS-2000A (Chongqing Kanghua
Technology Co., Ltd.).
VEP of both eyes recorded simultaneously with
M-sequence
Clinical VEP typically tests each eye
separately. Since the M-sequence is a multiple inputs,
single output system, its characteristics allow for the analysis of individual
response to each input from a single summed output. Therefore, we designed a
computer program to record VEPs of both eyes simultaneously using red and green
glasses �V green for the right eye and red for the left. The red and green
checkerboard reversal follow the 0 and 1 of an
M-sequence. In terms of M-sequence algorithm, this is a much smaller scale than
Erich Sutter's multifocal ERG, using only two elements: the left and right
eyes. The red checkerboard of left eye follows M-sequence M(1) �V checkerboard 1
is displayed when M(1) is 0, and checkerboard 2 is displayed when M(1) is 1;
the green checkerboard of right eye follows M-sequence M(2) �V checkerboard 1 is
displayed when M(2) is 0, and checkerboard 2 is displayed when M(2) is 1. The
left figure shows the conventional black and white checkerboard reversal, and
the right figure shows the red and green checkerboards reversed following the
M-sequence, which records the VEP of both eyes simultaneously.

We compared the VEP��s of (1) checkerboard
reversal following M-sequence and (2) the conventional checkerboard reversal at
regular frequency. From top to bottom are 4 successive
half-sized checkerboard (see figure). It can be seen that by recording both eyes simultaneously
based on M-sequence, we obtained almost identical NPN waveforms of pattern VEP.
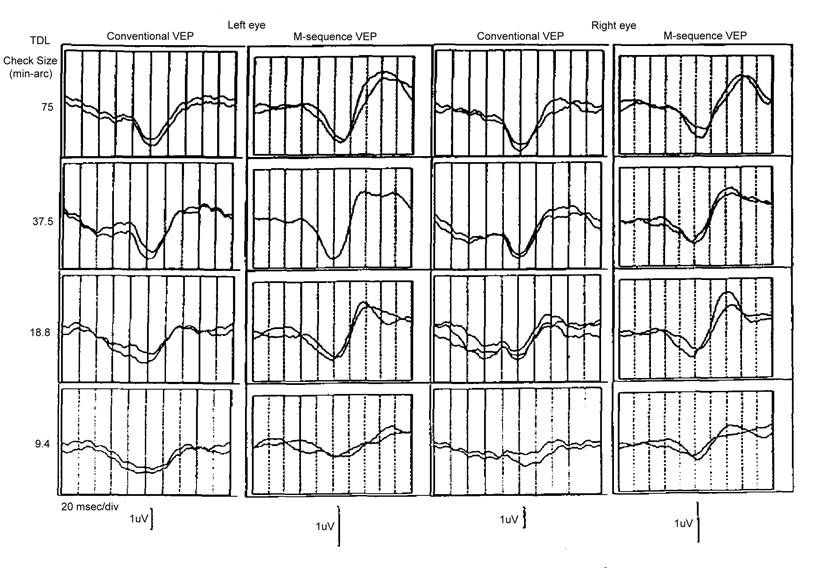
Conventional VEP
M-seq VEP Conventional VEP M-seq VEP
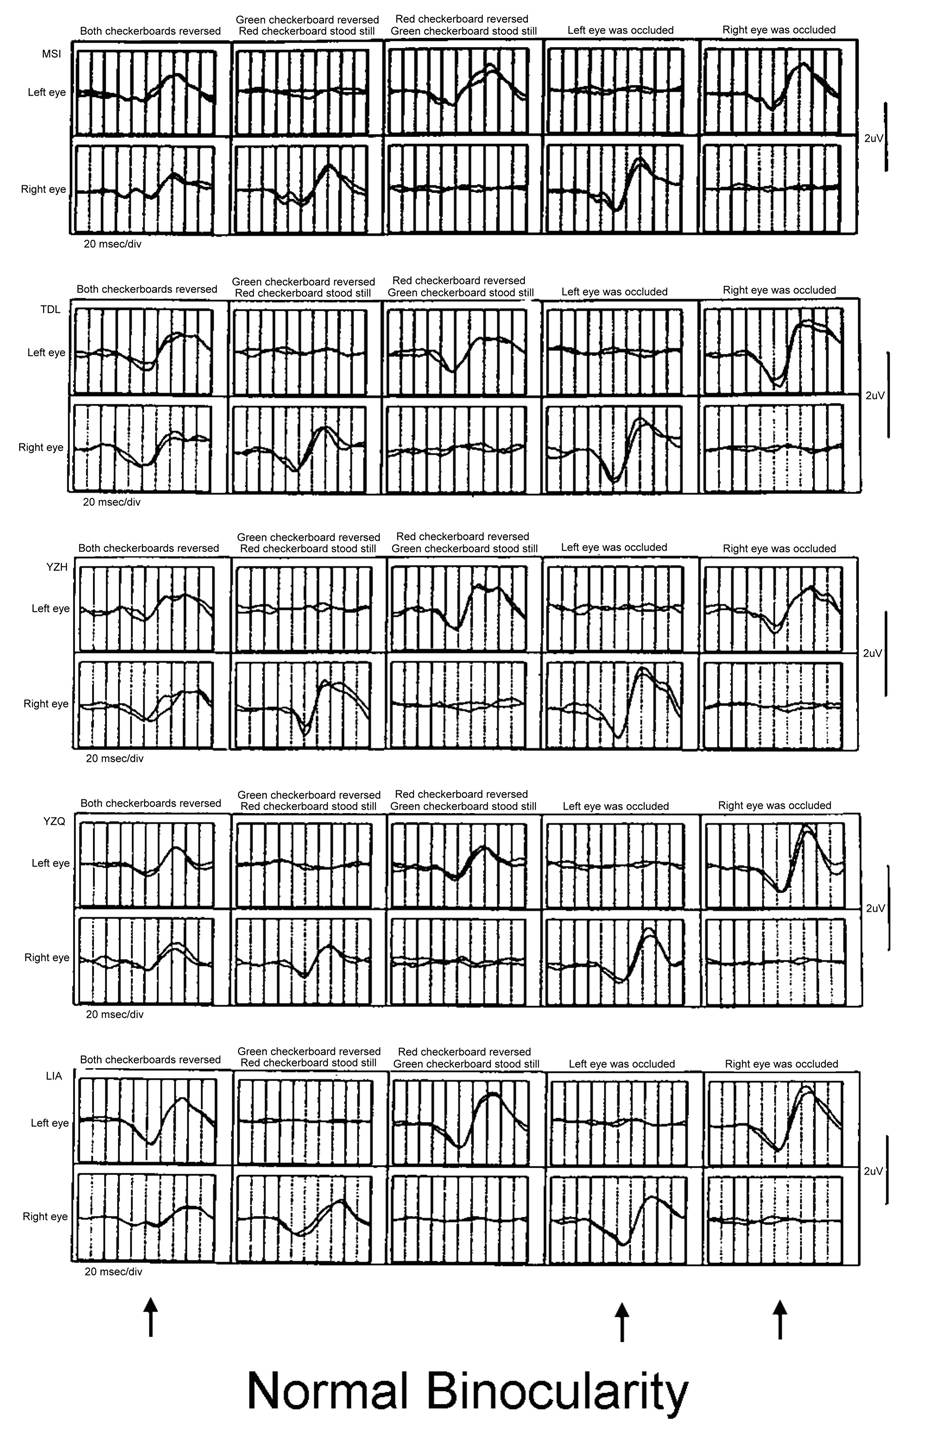
Both eyes recorded simultaneously also allows
us to observe whether there is any interaction between the two eyes. We
recorded five items �V
(1) both eyes looking simultaneously,
(2) the checkerboard viewed by left eye is
stationary,
(3) the checkerboard viewed by right eye is
stationary,
(4) the left eye is covered and only the right eye
views the checkerboard, and
(5) the right eye is covered and only the left
eye views the checkerboard.
(1)
 (2)
(2)
 (3)
(3)
 (4)
(4)
 (5)
(5)
These are five individuals with normal
binocular vision and stereopsis. The amplitudes of the simultaneous recording
of both eyes with M-sequence (left column) is only half that of one-eye
recording (right two columns).
These are six patients with poor binocular
vision who failed the stereopsis test. The amplitudes of the simultaneous
recordings of both eyes with M-sequence (left column) and the amplitudes of the
monocular recordings (right two columns) are almost identical.
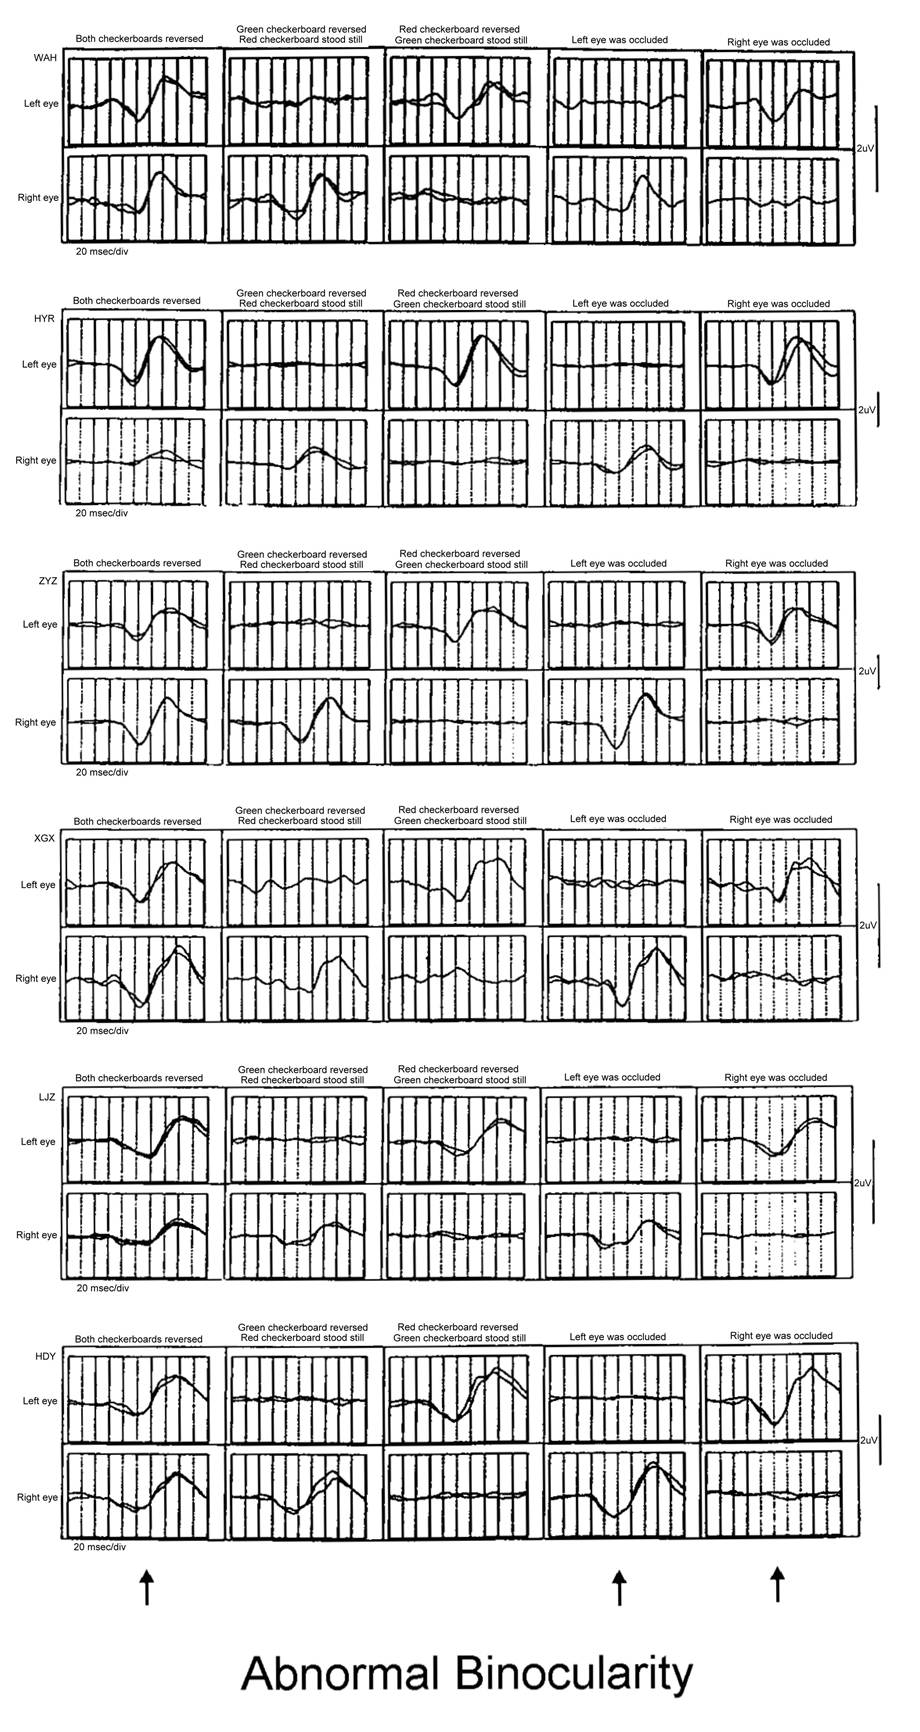
Dr. Suzanne McKee coined
the term ��fusional suppression��, which refers to the phenomenon that in
subjects with normal binocular vision, the interaction between two eyes
suppresses the individual activity of each eye. In engineer��s terms, the
interaction between the two eyes diverts some of the energy from monocular
vision to binocular vision, thus reduces the VEP of
either eye when recorded simultaneously. In subjects with poor binocular
vision, however, the energy remains in each eye's individual monocular vision,
and the VEP of either eye as recorded simultaneously do not decrease,
maintaining the same amplitude as in monocular recording.
References for Fusional Suppression:
McKee SP, Harrad RA. Fusional suppression in
normal and stereoanomalous observers. Vis Res. 1993 Aug;33(12):1645-58.
Fu
VL, Norcia
AM, Birch EE. Fusional
Suppression in Accommodative and Infantile Esotropia. Invest Ophthal
& Vis Sci May 2006, Vol.47, 2450. ARVO Annual Meeting
Abstract May 2006.
Birch
EE, Fu
VL, Norcia AM. Fusional
Suppression During Infancy. Invest Ophthal & Vis
Sci May 2006, Vol.47, 2449. ARVO Annual Meeting Abstract May 2006.
The above demonstrates our
use of a small-scale M-sequence algorithm with only two elements to record VEP��s
from both eyes simultaneously. Similar designs would be able to record VEP��s
from the nasal and temporal half visual fields of one eye (2 units)
simultaneously; record VEP��s from the nasal and temporal half visual fields of
both eyes (4 units), and so on. The interaction between the nasal visual fields
(temporal retina, uncrossed optic pathway) is of great interest because the
uncrossed optic pathway is evolutionarily new. In a long history when two eyes
gradually moved from lateral positions to anterior positions of the head,
resulting in partial overlap of the visual fields and the development of
binocular vision. Increasing proportion of uncrossed nerve fibers in the
evolutionary process should be closely related to the mechanism of binocular
vision.
Multifocal ERG and VEP
examinations are somewhat similar to visual field examinations. The latter is a
psychophysical examination in which the subject responds subjectively, while
the former is an objective recording of electric potentials.
Some researchers have ever
recorded multifocal pupillary light reflexes. They tried to isolate the
contribution of each retinal locus to the pupillary light reflex.
Others have tried to
bleach red and green cones with yellow background, then recorded multifocal ERG
of blue cones using dim blue hexagons, to follow up the progression of glaucoma
which damages blue cone more than red and green cone pathways.
In short, free your
imagination and make good use of M-sequence �V a powerful system of multiple
inputs and single output. It can isolate and analyze the response to each
individual input from the summed single output.