Convolution (Image processing)
Ai-Hou Wang, M.D., P.D.
Wikipedia:
Convolution is a mathematical operation on two functions that produces a third function,
representing how the shape of one is modified by the other. It's
calculated by "sliding" one function over another, flipping one of
them, and integrating the product at each step.
In image processing, a kernel, convolution
matrix, or mask is a small matrix used for
blurring, sharpening, embossing, edge detection, and more.
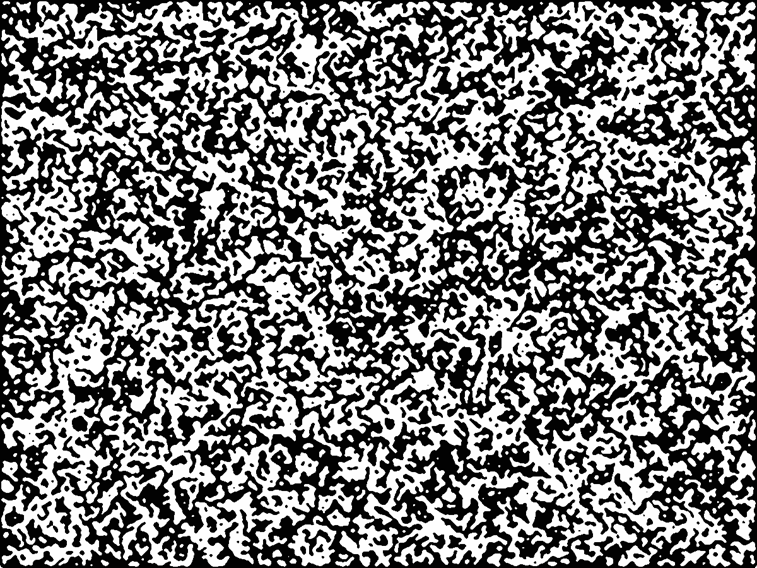
Each pixel (picture element)
that makes up a random dot pattern is a randomly generated black or white dot,
with white dots representing 1 and black dots representing 0. A computer
program can be configured to generate 10% white dots, 30% white dots, 60% white
dots… and so on. 30% white dots means 70% black dots. A 50% white, 50% black
random dot pattern is the most commonly used to create random dot stereograms.
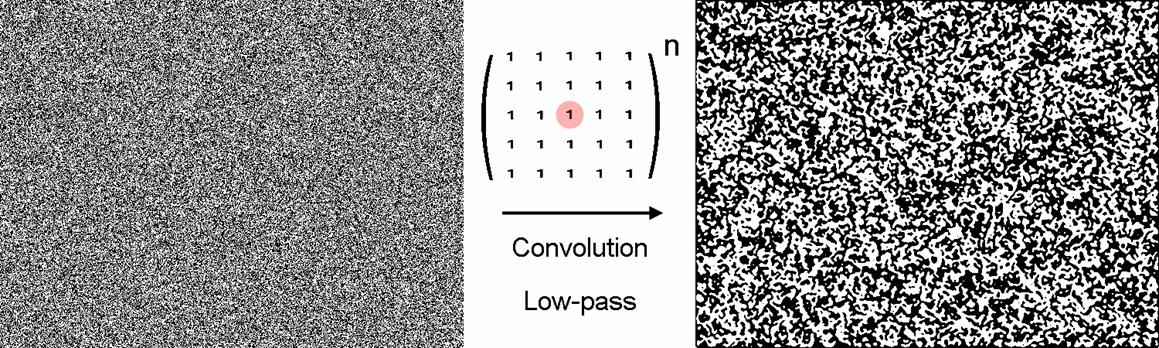
his is a 3x3 pixel convolution
kernel (see figure). For each dot in the random dot pattern, the 0 or 1 of this
position and its eight surrounding positions is multiplied by the 1 at the
corresponding position of the kernel, with the maximum sum being 9 and the
minimum being 0. At this position in the other image, if the sum is between 5
and 9, a white dot is drawn; if the sum is between 0 and 4, a black dot is
drawn. This operation of each position with its surrounding points is called a
convolution.
The probability of the sum of
0-4 and the sum of 5-9 is 50%/50%. After this convolution, a 50% density random
dot pattern remains to be 50% density.
The convolution kernel can be 5x5
pixels (see figure). The maximum sum of the operation is 25 and the minimum is
0. If the sum is 13-25, draw a white dot, and if the sum is 0-12, draw a black
dot.
Original random-dot pattern with 50% density
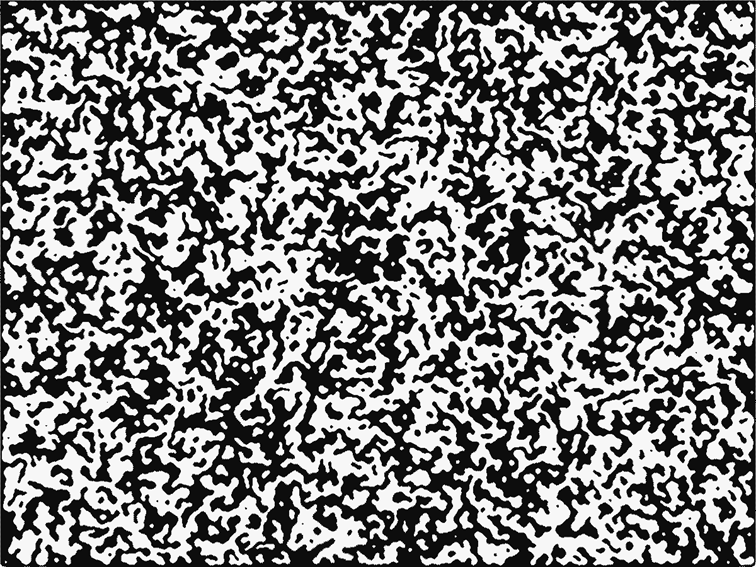
After 5 convolutions with 5x5 low pass kernel
After 10 convolutions with 5x5 low pass kernel
Larger 7x7 convolution kernel
This all-1’s convolution kernel removes
high-frequency components (fine details) from the
image and extracts low-frequency components (contours). It's like smearing a
charcoal drawing with a steamed bun, blurring it.
This is very useful for creating small-disparity
random-dot stereograms.
If, on a 6x4-inch photo, you want to replicate
the 15 second-of-arc angle stereogram of TNO Stereotest, meaning the visual angle of each pixel is as
small as 15 seconds, how many pixels are needed at 40cm test distance? The
calculation is as follows:
6 x 2.54 / n / 40 x 180/pi x 60 x 60 = 15ӈ n =
5239 pixels
5239 pixels / 6 inch ~=
900 dpi (dots per inch)
We’ll
need printer of resolution better than 900 dpi to print
this stereogram.
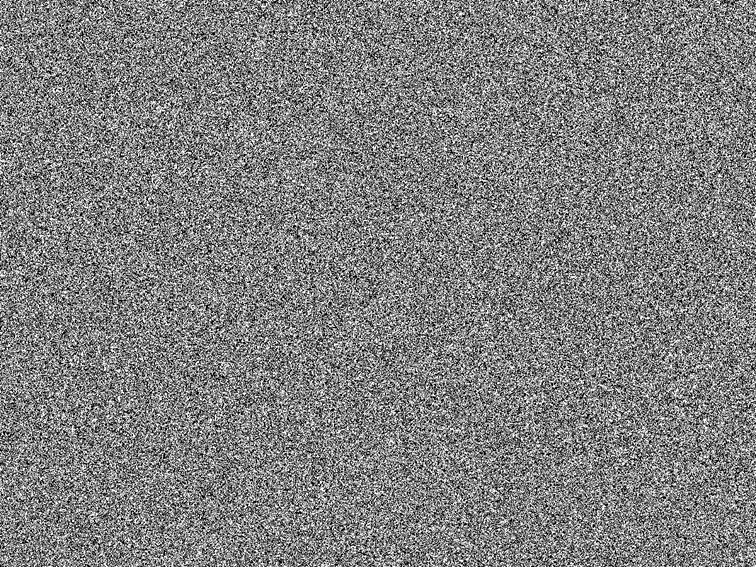
A high-density random-dot pattern appears grayish
and lacks the texture for binocular fusion. We thus have to
convolve it to remove its high spatial frequencies components.
As shown above, removing high spatial
frequencies with convolution increases the texture for fusion, yet without
affecting the binocular disparity between the left and right half-stereograms.
A square convolution kernel with an odd number
of 1’s on its side has an odd number of total pixels. For example, a
convolution kernel with 7 1’s on its side has 49 pixels. The minimum sum is 0,
and the maximum is 49, for a total of 50 levels. The probability of drawing a
sum between 0 and 24 as 0 is the same as the probability of drawing a sum
between 25 and 49 as 1. Therefore, a random dot pattern of 50% density will keep
50% density after multiple convolution operations.
If the probability of drawing 0’s and 1’s is
unequal, the random dot density will change after each convolution operation.
For example, this is a convolution kernel that
extracts high-frequency components of an image, such as edges,
angles in the image. The minimum sum of the calculated values is -8, and the
maximum is 8, with a total of 17 levels.
If we draw 0 when the sum is -8 to 0 and draw 1
when the sum is 1 to 8. The probability of drawing 0 is slightly higher, and
after multiple convolution operations, the proportion of 0 will increase.
If we draw 0 when the sum is -8 to -1 and draw
1 when the sum 0 to 8. The probability of drawing 1 is slightly higher, and
after multiple convolution operations, the proportion of 1 will increase.
To avoid this, the convolution kernel can be
slightly changed to
Let
the minimum sum be -8 and the maximum be 9, for a total of 18 levels. Draw 0
for sums between -8 and 0, and 1 for sums between 1 and 9. The probability of
drawing 0 is equal to the probability of drawing 1, so a random dot pattern
with 50% density will remain 50% density after multiple convolution operations.
Image processing can use different convolution
kernels to separate low and high spatial frequencies in an image:
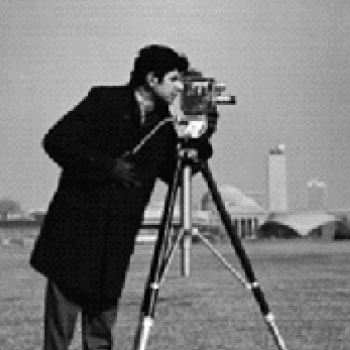
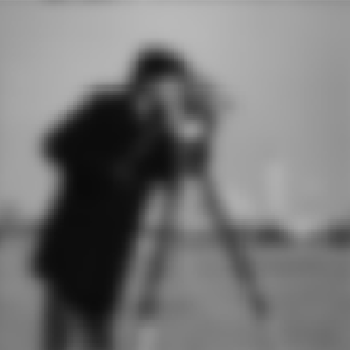
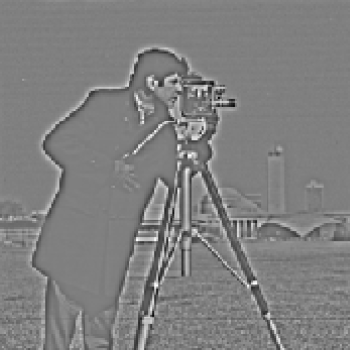
Original Low
pass High pass
This is a low-pass convolution
kernel (which passes low spatial frequency components in the image).
These are high-pass convolution kernels (which
passes high spatial frequency components in the image).
The receptive field of retinal ganglion cells
is shaped like concentric circles (see figure): There are on-center ganglion
cells, which are activated by light to the center and inhibited by light to the
periphery. There are off-center ganglion cells, which are inhibited by light to
the center and activated by light to the periphery. However, when the area of light
is large to cover the whole receptive field, the ganglion cells won’t fire.

This is a bit like high pass convolution
kernel:
On-center Off-center